
Trend
bouncer forex strategy is a trend following system that use the
Bollinger Bands, the purpose of this trading system is to find the
retracement during a trend and get in to trade with the trend. In an
uptrend, you will fi nd that, at a certain point in time, prices will
pull back or retrace before continuing with the upward movement.
Similarly for a downtrend, prices will retrace upward against the
downward momentum before continuing their way down again. Experienced
trend traders usually wait for the retracement to happen before
taking a trade in the direction of the trend. This is how the trend
bouncer strategy came about. The Bollinger Bands indicator provides
an objective way of identifying the ebb-and-flow movement of a
trend. Since this is a trend strategy, we have more than one profit
target. In fact, we have two specific profit levels for this
strategy. The strategy differs slightly from the trend rider in that
there are specific levels for trend bouncer traders to exit with
profits.
Time
Frame H1 and H4
Currency
pairs: Majors (example EUR/USD, USD/JPY, GBP/USD, USD/CHF, USD/CAD,
AUD/USD,NZD/USD.
Indicators:
Bollinger
Bands (moving average MA 12, deviation Dev2);
Bollinger
Bands (moving average MA 12, deviation Dev4).
Trend
line tool.
When
the candlestick hits the upper band of Bollinger Bands (MA 12, Dev
2), it indicates an upward mmentum, and we prepare to go long. As
prices retrace back to the MA 12
(the
center line of the Bollinger Bands), a significant retracement has
occurred, and it is a good time to enter for a long trade.
When
the candlestick hits the lower band of the Bollinger Bands (MA 12,
Dev 2), it indicates a downward momentum, and we prepare to go short.
As prices retrace back to the MA12 (the center line of the Bollinger
Bands), a significant retracement has occurred, and it is a good
time to
enter
for a short trade. This trend strategy exits at two different
targets.
Buy
Find
an up trend and draw trend line.
Wait
for the price to hit the upper band of the first Bollinger Bands (MA
12, 2) and retrace back down to the center MA 12.
When
the price touches MA 12, enter for a long.
When
the trend line is broken to downward no longer buy.
The
stop loss is the lower band of the second Bollinger Bands (MA 12, 4).
The
trade will have three profit targets with risk to reward ratios of
1:1, 1:2. |
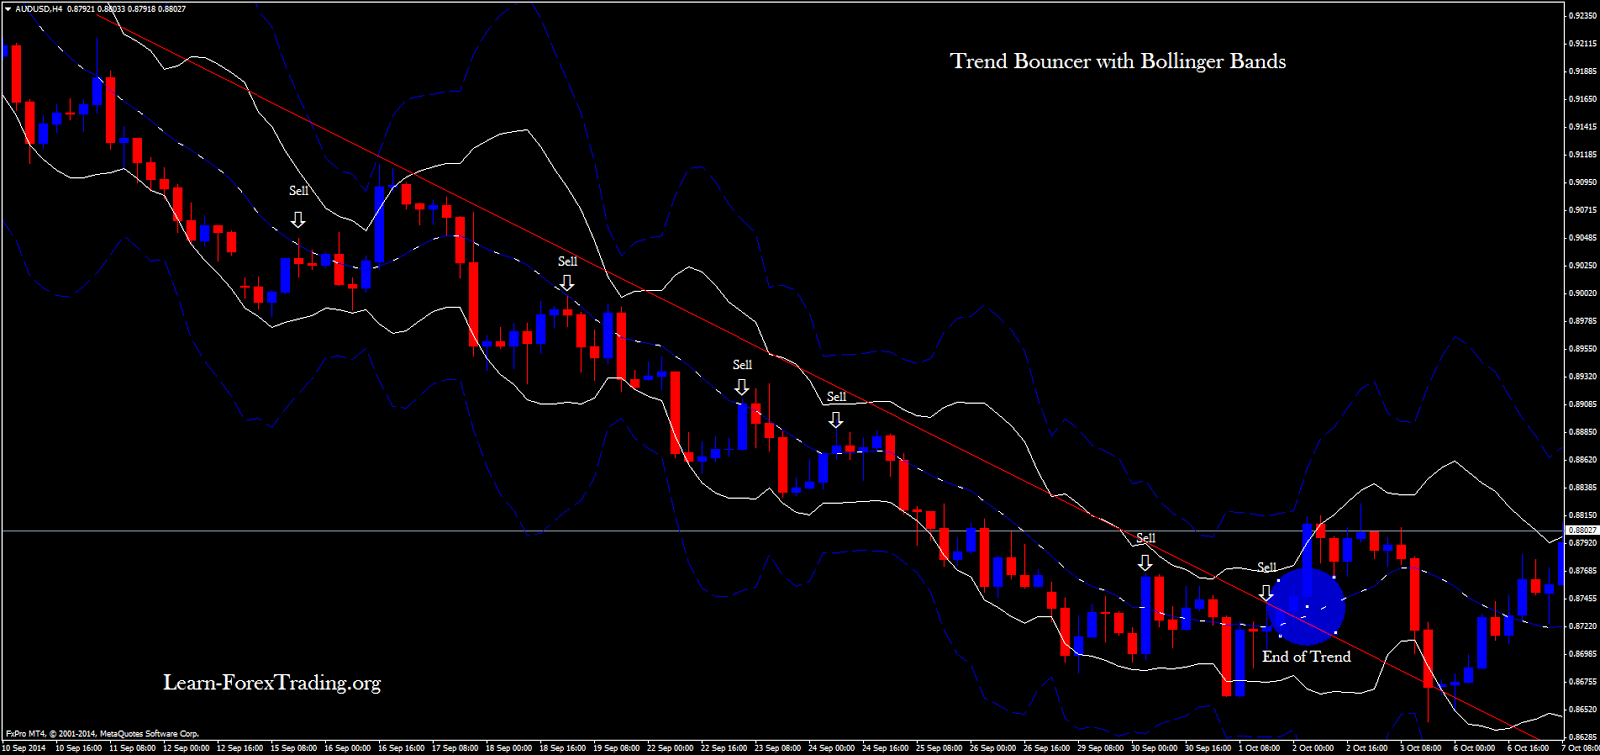
| Trend bouncer .with bollinger bands |
Sell
Find
an down trend and draw trend line.
Wait
for the price to hit the lower band of the fi rst Bollinger Bands (MA
12, Dev 2) and retrace back up to the center MA 12.
When
the price touches MA 12, go for a short.
The
stop loss is the upper band of the second Bollinger Bands (MA 12 Dev
4).
When
the trend line is broken to downward no longer sell.
The
trade will have three profit targets with risk to reward ratios of
1:1, 1:2.
 |
Trend Bouncer with Bollinger Bands Quiz
Trend Bouncer with Bollinger Bands Quiz
Post a Comment