
There is a little-know candle formation
that is highly accurate and very tradable, but it is seldom used or
even noticed. It's called the Rejection Spike.
When you are aware of this particular
spike formation, you will have a clearer heads-up of a potential
trade or when you should be considering exiting a trade you are
already in.
The Rejection Spike is a reversal
formation and always occurs at a nearby level of support or
resistance.
Price will push through a recent level
of support or resistance, but fail to close past it. This will cause
a spike formation at this level and from there the price will
generally move away from this level. Levels of support and resistance
are very important to traders, they become psychological price points
that have an effect on the price action. Traders buy and sell off
these levels, and failed attempts to push past them provide excellent
trading opportunities.
Bearish Rejection Spike
A Bearish Rejection Spike will occur
when the market is moving upwards to a level of resistance. The price
will move up and past this level and then get pushed back down below
this level of resistance and end up closing below it.
The attempt of the market to climb
higher was denied by the sellers. There is more selling pressure than
buying pressure, and this can come from a couple of things.
1. Traders closing long trades at this
level of resistance as it was being used as a target. (In order to
close a long trade, it must be countered with a sell trade. This
happens automatically when you
close a position.)
2. Traders opening short positions once
price has tagged this level of resistance. (This level has proven to
be a reversal point recently, so a new short trade at this level
becomes a safe bet)
SELL TRADE RULES
1. Price has to form a level of
resistance.
2. Price has to cross above the level
of resistance (without closing
above it).
3. Price has to pull back below the
level of resistance and close below it.
4. Enter a short position on the close
of that candle.
5. Place the Stop Loss few pips above
the spike of the candle.
6. Place the Take Profit same distance
away from the entry (1:1).
Alternatively, you can use the 2:1
reward to risk ratio.
7. Manage your trade by choosing one of
the options.
TRADE MANAGEMENT OPTIONS
1. Trail your stop loss. With Stop Loss
Trailing, your Stop Loss level will automatically update as the price
moves.
2. Move to Break Even. Once the price
has reached 50% of the target distance, move your stop loss to break
even.
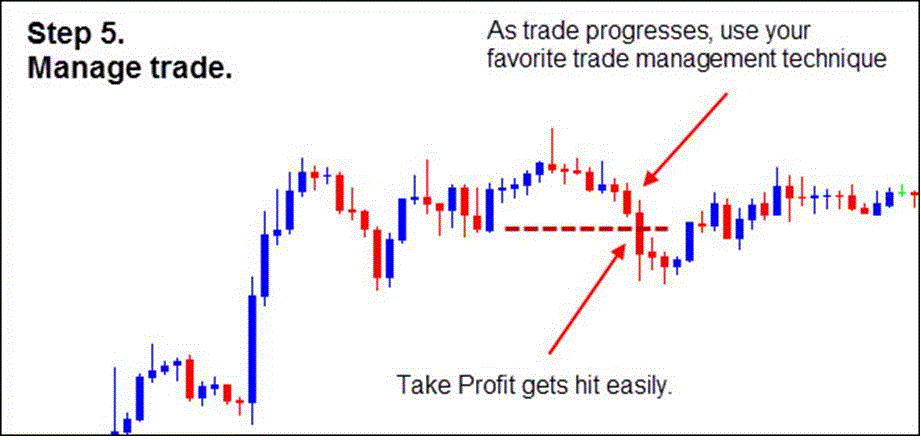
Step 1.
Price will form a level of resistance.
Step 2.
Price will move above the level of
resistance.

Step 3.
Price gets pushed back down and closes
below level of resistance.

Step 4.
Enter a short position on close of
candle.
Stop loss will be placed over the high
of the spike and place your take profit at 1:1 or a 2:1.

Manage the trade as it progresses.
Sell Trade Example 1
Let’s take a look at this trade
example.
First of all, price must form a level
of resistance (1). After that, price has to cross above that level of
resistance (2). After the price pulls back and closes below the
resistance level (3), we enter the short trade (4). Finally, we’ll
set the Stop Loss and Take Profit. Stop Loss goes few pips above the
spike of the candle (5). Take profit is set at 1:1 or 2:1 ratio (6).
Note:
If you are uncertain about which reward
to risk ratio to use (1:1 or 2:1), then always go for the 1:1 reward
to risk ratio. Your profit target will be the same number of pips as
your stop loss.
Sell Trade Example 2
Here’s a second short trade example.
First we see price formed a level of
resistance (1). After that, price has to cross above that level of
resistance (2). After the price pulls back and closes below the
resistance level (3), we enter the short trade (4). Finally, we’ll
set the Stop Loss and Take Profit. Stop Loss goes few pips above the
spike of the candle (5). Take profit is set at 1:1 or 2:1 ratio (6).

Note:
If you are uncertain about which reward
to risk ratio to use (1:1 or 2:1), then always go for the 1:1 reward
to risk ratio. Your profit target will be the same number of pips as
your stop loss.
Bearish Rejection Spike
A Bullish Rejection Spike will occur
when the market is moving downwards to a level of support. The price
will move down and past this level and then get pushed back up above
this level of support and end up closing above it.
The attempt of the market to drop lower
was denied by the buyers. There is more buying pressure than selling
pressure, and this can come from a couple of things.
1. Traders closing short trades at this
level of support as it was being
used as a target. (In order to close a
short trade, it must be countered with a buy trade. This happens
automatically when you close a position.)
2. Traders opening long positions once
price has tagged this level of support. (This level has proven to be
a reversal point recently, so a new long trade at this level becomes
a safe bet)
BUY TRADE RULES
1. Price has to form a level of
support.
2. Price has to cross below the level
of support (without closing below
it).
3. Price has to pull up above the level
of support and close above it.
4. Enter a long position on the close
of that candle.
5. Place the Stop Loss few pips below
the spike of the candle.
6. Place the Take Profit same distance
away from the entry (1:1).
Alternatively, you can use the 2:1
reward to risk ratio.
7. Manage your trade by choosing one of
the options.
TRADE MANAGEMENT OPTIONS
3. Trail your stop loss. With Stop Loss
Trailing, your Stop Loss level will
automatically update as the price
moves.
4. Move to Break Even. Once the price
has reached 50% of the target
distance, move your stop loss to break
even.
Step 1.
Price will form a level of support.

Step 2.


Buy Trade Example 1

Buy Trade Example 2


Step 2.
Price will move below the level of
support.

Step 3.
Price gets pushed back up and closes
above level of support.

Step 4.
Enter a long position on close of
candle.
Stop loss will be placed below the low
of the spike and your take profit can
be a 1:1 or a 2:1 or whatever exit
method you prefer.

Step 5.
Manage the trade as it progresses.


Buy Trade Example 1
Let’s take a look at this trade
example.
First of all, price must form a level
of support (1). After that, price has to
cross below that level of support (2).
After the price pulls up and closes
above the support level (3), we enter
the long trade (4). Finally, we’ll set the
Stop Loss and Take Profit. Stop Loss
goes few pips below the spike of the
candle (5). Take profit is set at 1:1
or 2:1 ratio (6).
Buy Trade Example 2
Let’s take at another buy trade
example.
First of all, price must form a level
of support (1). After that, price has to cross below that level of
support (2). After the price pulls up and closes above the support
level (3), we enter the long trade (4). Finally, we’ll set the
Stop Loss and Take Profit. Stop Loss
goes few pips below the spike of the candle (5). Take profit is set
at 1:1 or 2:1 ratio (6).

Note:
If you are uncertain about which reward
to risk ratio to use (1:1 or 2:1), then always go for the 1:1 reward
to risk ratio. Your profit target will be the same number of pips as
your stop loss.
You will find the Rejection Spike all
over the place.
In the chart below, you will see
several instances where the Rejection Spike
works out and results in a profitable
trade.
 |
| Rejection Spike Pattern |
Post a Comment