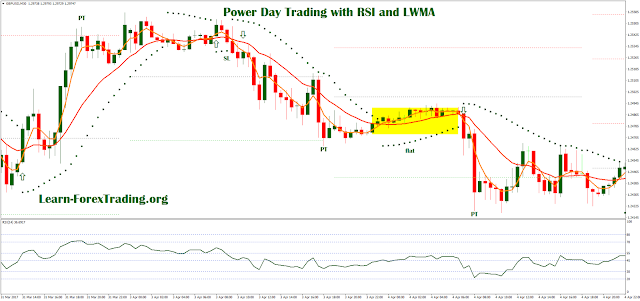
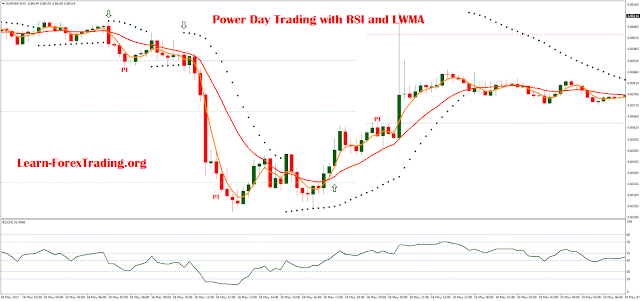
Power Day Trading with RSI and LWMA
is intraday strategy trend-momentum. The purpose of this strategy is
to filter out the ranges that you sometimes create in the market.
Time frame 15 min or 30 min.(I observed
that this system works well even at 60 min time frames.)
Currency pairs: EUR/USD, USD/CHF,
GBP/USD, AUD/USD, USDF/JPY, GBP/JPY, EUR/GBP.
Indicators
Draws pivot points levels on the chart.
RSI 14 period witj following levels:
20, 30, 45, 55, 70, 80.
Parabolic SAR (0.11 – 0.011).
LWMA 5 period, close.
LWMA 20 period, close.
Trading Session: London and New York.
Low spreads less of 2 pips.
Rules Power Day Trading with RSI and
LWMA
Buy
LWMA fast (5)
above LWMA slow (20).
Parabolic dot
below the price.
RSI (14) above of
level 55.
Sell
LWMA fast (5)
below LWMA slow (20).
Parabolic dot
above the price.
RSI (14) below of
level 45.
Re-enter in same
direction is optional.
Exit when the LWMA
changes direction or at the levels of pivot points. Place stop loss
below/above the parabolic dot.
This strategy is
profitable.
Below the link for download Power Day
Trading with RSI and LWMA MT4 tempate:
https://drive.google.com/file/d/0Bwjv2Pbf48itc0NqOXplLWpTQ28/view?usp=sharing


Post a Comment