How is a candlestick constructed? The
basic parameters of the candlestick include a body circumscribed by
the open and the close and two wicks or shadows that demarcate the
high and the low. If the close is lower than the open, then the
candle is dark or bearish (see Picture 1). If the open is higher than the close, then
the candle is white or bullish (see Picture 2).
There are numerous candlestick
formations, but all of them essentially fall into three categories:
1. Breakout patterns
2. Indecision patterns
3. Reversal patterns |
| Bearish Candle |
 |
| Bullish Candle |
What is the differences between bar
chart and candlestick chart?
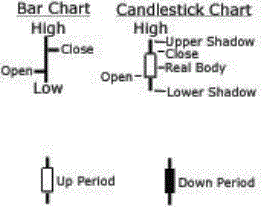
Both the bar chart and the candlestick
chart contain exactly the same information, only it's presented to
the trader in different form. Both the bar chart and the candle chart
contain the same data: the high for the period (the day), the low,
the open and the close. In a candlestick chart, however, the names
are changed. The difference between the open and the close is called
the real
body. The amount the stock went higher
beyond the real body is called the upper shadow. The amount it went
lower is called the lower shadow. If the candle is clear or white it
means the
opening was lower than the high and the
stock went up. If the candle is colored then the stock went down.
This information is shown below in picture 3:
 |
| Differences between bar chart and candlestick chart |
What is the meaning of candlesticks
patterns?
Japanese candlesticks offer a quick
picture into the psychology of short-term trading, studying the
effect, not the cause. This places candlesticks squarely into the
category of technical analysis. One cannot ignore the fact that
prices are influenced by investor's psychologically driven emotions
of fear, greed, and hope. The overall psychology of the marketplace
cannot be measured by statistics; some form of technical analysis
must be used to analyze the changes in these psychological factors.
Japanese candlesticks read the changes in the makeup of investor's
interpretations of value. This is then reflected in price movement.
More than just a method of pattern recognition, candlesticks show the
interaction between buyers and sellers. Japanese candlestick charting
provides insight into the financial markets that is not readily
available with other charting methods. It works well with either
stocks or commodities.
What are the advantages of
candlesticks chart how tool for trading in the financial markests?
There are three major advantages of
candlestick charts |when compared to to bar charts.
First - Candlestick charts are much
more "visually immediate" than bar charts. Once you get
used to the candle chart, it is much simpler to see what has happened
for a specific time frame be it a day, a montlhy or 30 minutes. With
a bar chart you require to mentally fill in the price action. You
need to say to yourself, "The left tick says that's where it
opened, the right tick where it closed. Now I see. It was an up day."
With a candlestick chart it is done for you. You can spend your
energy on analysis, not figuring out what happened with the price.
Second - With candles you can spot
trends more quickly by looking for whether the candles are clear or
colored. Within a period of trend, you can easily tell what a stock
did in a specific period. The candle makes it easier to spot "large
range" days. A large candlestick suggests something "dramatic"
happened on that trading day. A small range day suggests there may be
relative consensus on the share price. When I spot a large range day,
I check the volume for that day as well. Was volume unusual? Was it
say 50% higher than normal? If so, it is very likely that the large
range day may set the tone for many days afterward.
Third -Most important, candles are
vital for spotting reversals. These reversals are usually short term
precisely the kind the trader is looking for. When traditional
technical analysis talks about reversals, usually it is referring to
formations that occur over long periods of time. Typical reversal
patterns are the double top and head and shoulders. By definition,
these involve smart money distributing their shares to naive traders
and normally occur over weeks or even months. Candlesticks, however,
are able to accurately pick up on the changes in trend which occur at
the end of each short termswing in the market. If you pay meticulous
attention to them, they often warn you of impending changes.
Candlesticks is most powerful when the
markets are at an extreme, that is when they are overbought or
oversold. I define overbought as a market which has gone up too far
too fast. Most of the buyers are in and the sellers are eager to nail
down profits.
An oversold market, on the other hand,
is one in which the sellers have been in control for several days or
weeks. Prices have gone down too far too fast. Most of the traders
who want to sell have done so and there are
bargains -- at least in the short term -- to be had. But these
issues will be discussed in the advanced tutorials.

Post a Comment