In
trading I look at high probability setups rather
than certainties which is the best tool and that makes trading
profitable. Remember technical analysis – indicators are lagging;
it’s all based on history. Hence I have kept my method short &
simple and wish you every possible success.
Chart Setup
Chart Setup
The
chart is set at candlestick view; Bollinger Bands are inserted
with parameters set to: period as 20, shift as zero and deviation to
2.
Stochastic
is also inserted with the following inputs: KPeriod = 14, DPeriod = 3
and Slowing = 7.
Support
Line (S/L) and Resistance Line (R/L) are drawn on the candlestick
chart by looking at the previous sessions. When price breaks or fails
through the S/L or R/L a high
probability setup area
is signalled.
A
trend line is also drawn if one exists and when the price breaks and
closes outside the trend line a high
probability setup area
is signalled.
When
price breaks; fails or closes inside of the Bollinger Bands (BB) a
high
probability setup area
is signalled.
Now
let’s look at some example setups that
demonstrate high probability entries.
Short
Trade Example 1
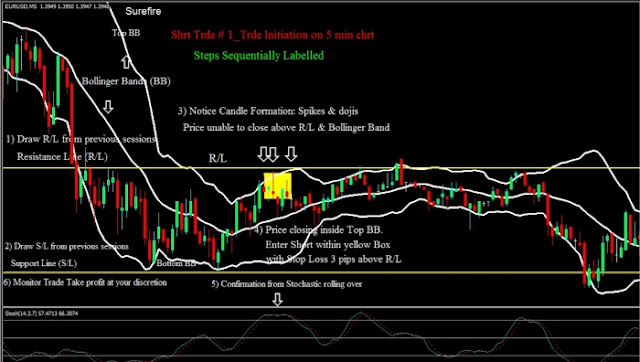
On
the above EUR/USD 5 min
chart
the shaded yellow area is a setup
where
price touches and closes inside the Top BB and also below the
Resistance Line (R/L). A short trade is entered within the yellow box
with a stop loss 3 pips above the R/L. Profit is taken when price
touches the bottom BB.
Stochastic
is used to further confirm that price has reached over bought and has
started to roll over. Short
Trade Example # 2
On
the above EUR/USD 15min
chart
the shaded yellow area is a setup where price touches and closes
inside the Top BB and also below the Resistance Line (R/L).
Additionally the Doji candles followed by a bearish candle telling us
that the price wants to go down. A short trade is entered within the
yellow box with a stop loss 3 pips above the R/L. Profit is taken
when price touches the bottom BB.
Stochastic
is used to further confirm that price has reached over bought and has
started to roll over. Short Trade Example # 3
On
this 15 min EUR/USD
chart shaded yellow area the market is been side ways for well over 3
hours. We have R/L & S/L drawn from previous sessions, as it is
difficult to say which way the market will move we therefore wait for
the price to break either the R/L to go long or the S/L to go short.
Sure
enough the price breaks and closes below the S/L and outside the
bottom BB; the big red candle. Hence we enter a short trade 3 pip
below the close of this candle with a stop loss 3 pips above previous
S/L now R/L.
Monitor
the trade and take profit when the price closes inside the BB.
Stochastic
is turning down & is used to further confirm that price could go
further south. Short Trade example #4
On
this 1hour EUR/USD chart shaded yellow area price touches top BB also
area of resistance denoted by the R/L line drawn from prior sessions.
Price starts to back off slowly; closing inside the top BB. Enter
short at the 3rd candle after the touch of the Top BB with a stop
loss 3 pips above the R/L. Take note the stop loss is bigger from
point of entry for a potential huge gain, since this trade is on an
hourly chart you must allow enough room for price movement that you
don’t get stopped out and then price reverses & continues back
in the original direction.
Monitor
the trade: You may trail stop loss the trade by moving the stop loss
once in the money after the close of the 1 hour candle. The stop loss
would be moved a few pips above the high of the previous bar and
subsequently trailed in the same manner until stopped out or take
profit at touch or close inside of the bottom BB.
At
point of order entry stochastic is turning down & is used to
further confirm that price could head further lower.
Long Trade Example #1
Long Trade Example #1
As
we notice on the above EUR/USD 5 min
chart price has broken & closed above the green
trend line. The price is also above the recent Resistance Line (R/L)
which now becomes Support line (S/L).
Enter
long at the best possible price within the yellow box with a stop
loss 3 pips below the now S/L. Monitor the trade: Profit is taken
when price reach’s the top BB.
Stochastic
is used to further confirm that price has not reached over bought and
still has room to run up.Long Trade Example #2
As
we notice on the above EUR/USD 15 minchart
price bounced off the S/L; has broken & closed above the green
trend line and also closed inside the bottom BB as denoted by the
hammer candle with a long spike.
Enter
long at the best possible price within the yellow box with a stop
loss 3 pips below the now S/L. Monitor the trade: Profit is taken
when price reach’s the top BB.
Stochastic
is used to further confirm that price has not reached over bought and
still has room to run up. Long Trade Example #3
As
we notice on the above EUR/USD 15 min
chart price has broken & closed above the green
trend line. The price is also above the Resistance Line (R/L) drawn
from previous sessions which now has become Support Line (S/L).
Enter
long at the best possible price within the yellow box with a stop
loss 3 pips below the now S/L. Monitor the trade: Profit is taken
when price reach’s the top BB.
Stochastic
is used to further confirm that price has not reached over bought and
still has lots of room to run up.
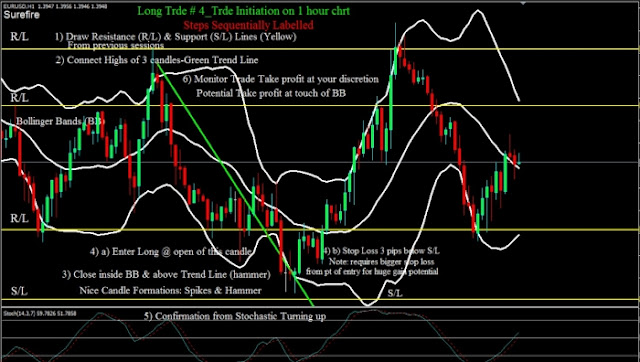
On
this 1hour EUR/USD chart price has broken & closed above the
green trend line and also closed inside the bottom BB as denoted by
the hammer candle with a long spike.
Enter
long at the open of the next candle with a stop loss 3 pips below the
Support Line (S/L) drawn from prior sessions. Take note the stop loss
is bigger from point of entry for a potential huge gain,


Post a Comment