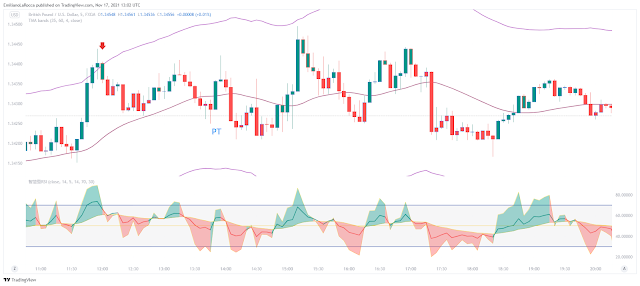
Scalping Overbought and Oversold with RSI (Relative Strength Index) and TMA (Triangular Moving Average) is a dynamic trading strategy tailored for swift profits, particularly in volatile market conditions. While originally designed for TradingView, this strategy is easily adaptable to other trading platforms by adjusting the RSI oscillator. Notably, it's also applicable to binary options trading, particularly in high/low scenarios. By capitalizing on the overbought and oversold levels of both indicators simultaneously, this strategy efficiently generates signals, making it particularly well-suited for Asian markets in scalping mode, while trending markets are best avoided. This forex strategy is also good for Binary Options High/Low.
Setup Strategy
Time Frame: 3 minutes or higher.
Currency Pairs: Synthetic pairs like EURGBP, EURCHF, AUDNZD, AUDCAD, AUDCHF, GBPCAD, GBPCHF, and others, or those suitable for local or medium trend markets.
Expiry Time (Binary Options High/Low): 5 candles.
Indicators on TradingView:
Triangular Moving Average (TMA): Parameters: 35, 60, 4.
RSI (Smart RSI): Default settings with levels set at 25-75 or 20-80.
(Search for indicators in TradingView > Indicators > Community Scripts > search for the indicator's name.)
Trading Rules - Reversal Scalping with RSI and TMA:
Buy
Price touches or exits the lower TMAs.
RSI dips below 25 or 20; upon rebounding above, and the line turns blue, initiate a buy.
SellPrice touches or exits the upper TMAs.
RSI surpasses 70 or 80; upon retracement below, and the line turns red, execute a sell.
Note Consider attempting a double entry in the same direction. Set stop-loss levels concerning the second entry.
Exit Position
Place stop-loss orders at the previous swing high/low, relative to the intended profit in the same direction.
Profit target at a minimum ratio of 1:1 stop loss or at the middle band of TMA.
Trade Examples
Buy Scenario
The price touches the lower TMAs, coinciding with RSI dipping below 25. Upon RSI rebounding above 25 and the line turning blue, execute a buy trade.Note Consider attempting a double entry in the same direction. Set stop-loss levels concerning the second entry.
Exit Position
Place stop-loss orders at the previous swing high/low, relative to the intended profit in the same direction.
Profit target at a minimum ratio of 1:1 stop loss or at the middle band of TMA.
Trade Examples
Buy Scenario
The price touches the lower TMAs, coinciding with RSI dipping below 25. Upon RSI rebounding above 25 and the line turning blue, execute a buy trade.
Sell Scenario
The price exits the upper TMAs, accompanied by RSI crossing above 70. Upon RSI retracement below 70 and the line turning red, initiate a sell trade.
In Conclusion
Scalping Overbought and Oversold with RSI and TMA strategy offers a systematic approach to capitalize on short-term market movements. By effectively combining these indicators, traders can identify appropriate moments for entry and exit, maximizing profitability in fast-paced trading environments.
Download
https://drive.google.com/drive/folders/12kmMXPaphZigLwfOezKMHkTqFJ535Yt-?usp=sharing


Post a Comment