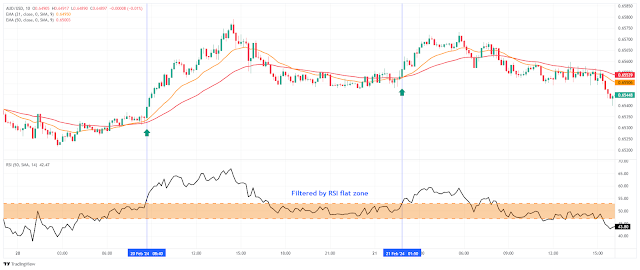
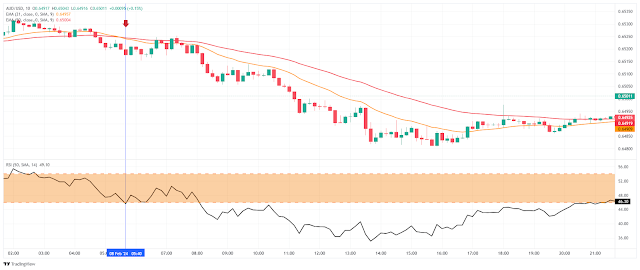
The EMA's 21-50 with RSI-Classic Strategy Modified for Day Trading is a well-known approach that I've tweaked for suitability within the 10 and 15-minute time frames. This strategy relies on identifying trends and momentum by observing the convergence of two exponential moving averages over 21 and 50 periods, complemented by the Relative Strength Index (RSI) set to a 50-period lookback, with buy and sell signals filtered within the range of 54-46.
Setup Strategy:
Time Frame: 10 minutes or 15 minutes.
Tradable Instruments: Major and minor currency pairs, as well as indices.
Indicators Used: TradingView platform.
Exponential Moving Average (EMA) over 21 periods, based on closing prices.
Exponential Moving Average (EMA) over 50 periods, based on closing prices.
Relative Strength Index (RSI) over 50 periods, calculated on closing prices, with buy signals identified above level 54 and sell signals below level 46. The zone between levels 46 and 54 indicates a neutral market.
Trading Rules:
Buy
EMA 21 crosses above EMA 50.
RSI is greater than 54.
Sell
EMA 21 crosses below EMA 50.
RSI is less than 46.
Exit Position
Profit Target Options:
based on Support and Resistance (SR) or Pivot levels, typically aiming for 15 to 30 pips, varying according to currency pairs. The stop loss ratio is set at 1:1.2.
Stop Loss
Placed at the previous swing high for sell positions or the previous swing low for buy positions.


Post a Comment