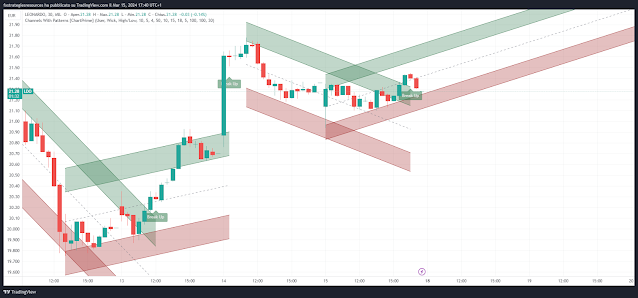
The Channels with Pattners script first starts by defining and collecting the relevant data for the main body of the code with data(). This generates the pivot data, the levels, the ranges, the averages, the deltas, and finally the candle sticks. Once there is a higher low, or lower high detected via the pivots and the current price it triggers the formation of the new channel. It takes the delta between the last pivot and the current average price and projects the trend channel using this delta. If the price exceeds the extremities of the channel it will classify this as a break from the estimated structure and begin looking for a new channel. The idea is that when trending, the price will oscillate between extremities as defined by a range and direction. If the price is inside of one of these extremities the script will look for candle stick patterns. This is how the script operates.
Traders can use this script as a general trend line indicator that is a bit more forward looking than others, or it can be used it as its full blown trend channel estimator. Due to the fact that this is an estimate using the minimum possible information to make the channel, its accuracy will not always be perfect and can suffer compared to alternative methods.
Setup Indicator
Preset:
Style:
"Wick"
Break Style: False (High/Low)
Instant
Mode: True
ATR Length: 10 (Stocks and Crypto), ATR Length 100
(Forex).
Size (ATR Multiplier): 4
Pivot Length: 10
Pivot
Look Forward: 15
Average H/L Length: 18
The Channels With Patterns indicator is an attempt at minimizing the delay in forming a trend channel. This indicator uses a single pivot in conjunction with a smooth version of the price to estimate the direction of an emerging trend. Using ATR, this indicator estimates the volatility of the new trend by adjusting the channel size by a multiple of the current ATR.
This indicator estimates the trend channel by checking if the price is moving in the correct direction and then it projects the channel from a single pivot. To allow for some margin of error, this script uses an offset to help center the channel.
The indicator provides Breakout Channel, Hammer, Inverter Hammer, Bullish Engulfing, Bearish Engulfing signals.
Time Frame of using Breakout Channel signals is 10 minutes or more.
While optionally the signals of the candlestick patterns H1 or higher and filter them with the MACD or the Stochastic. The core, however, are the breakout channel signals (Buy Break up an Sell Break down).
Buy
When price action breaks the bearish channel a break up signal is generated.
Get into position at the opening of the next bar.
Sell
When price action breaks the bullish channel, a break down signal is generated.
Get into position at the opening of the next bar.
Exit
Initial stop loss at previous swing high/low.
Profit Target minimum ratio stop loss 1:1 max 1:3.
Recommended Money Management: fixed 2%.
Note: Author of the script is ChartPrime, the script is free.
Download


Post a Comment